Students, masks and their political affiliations
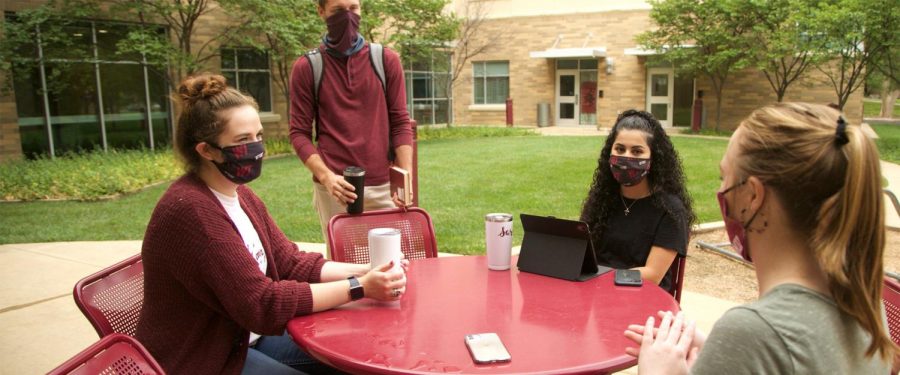
With the upcoming election less than a month away and with early voting in full swing, people will ask students questions regarding the event. As students, you’ve more than likely been stopped to answer some questions or even received emails regarding surveys. Recently, Bivins Professor of Political Science Dr. Dave Rausch surveyed students’ prevalence to wear masks and how that correlates to their political leanings.
Reported findings were provided by the survey itself, and the public release copy by Senior Communications Specialist Chip Chandler.
The survey itself took place from Oct. 2 through Oct. 9. Rausch sent a link to 10,037 students, including out-of-state students, of which 841 responded. The question linked to the email was, “In the past month, how often, if ever, have you worn a mask or face covering when in stores or other businesses?”
“Over three-quarters of the students (76.27%) reported wearing a mask or face covering all or most of the time,” Rausch said in his findings, “Less than 2% reported never wearing a mask.”
Of the 76.27% of students that reported wearing a face covering, 51.7% supported the Democratic presidential ticket, and 35.9% supported the Republican presidential ticket.
From the 13% of students that reported wearing a mask some of the time, 83.1% support the Republican ticket. The 10% who rarely or never wear face masks garner around 92% supports the Republican ticket.
If you’ve done the math, thankfully Rausch has; that’s 48.4% of responding students that support the Republican ticket, while 40.58% support the Democrat ticket. Eight% say they would instead vote for someone else, with about 2.5% saying they won’t vote.
Included in the survey, Rausch polled the support of incumbent United States Senator John Cornyn (R). Respondents recorded 39.84% in favor, while MJ Hegar (D) received 28.25%. More than 11% live outside Texas, with an additional 6.83% polling that they will not vote for senator.
In his findings, Rausch determined that “there is likely very little cross-party attraction.” Meaning that students who identify with specific policies or a political party will vote for the candidates championed by that affiliation.
“Virtually all students who identify as Democrats say they will vote for Biden,” Rausch said to Chandler, “and virtually all Republican-identifying students say they will vote for Trump.”
Over 39% of student respondents identify as Republican, 24.55% identify as Democrat and over 27% identify as Independent.
Of the 24.55% of self-identified Democrats, over 96% will vote Biden/Harris, with less than 1% cross-supporting. A little more than 95% of the 39% of self-identified Republicans will vote Trump/Pence, with 2% cross-supporting. Of the 11% of self-identified Independents, over 52% support Biden/Harris, and 26.7% support Trump/Pence.
Another factor in the survey, gender, provides some insight into the issue. Over 58% of the student respondents identify as female, with 41% identifying as male. Of the male respondents, 52% support Trump/Pence, and 33.1% support Biden/Harris. Of the female respondents, 45.8% support Trump/Pence, and 46.1% support Biden/Harris.
The survey provides great insight into the upcoming election. As early voting continues into the actual election, remember to stay educated on the candidates and vote according to your beliefs. We at The Prairie News encourage you to exercise your voice and right to vote.
Links to the survey and press release.
I strive to do and be my absolute best every day. My movie trivia knows no bounds. I am somewhat as swift as a coursing river.


